 Download PNG
 Download PNG
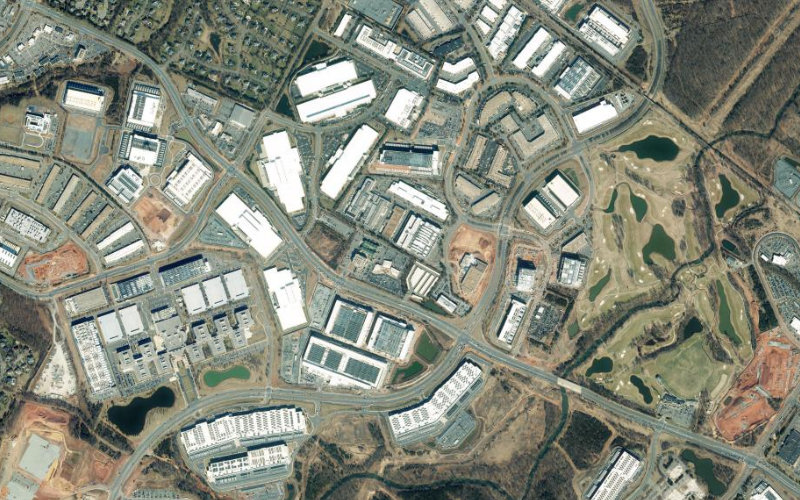 Ashburn, Virginia
- Upcoming projects in Virginia
- 299
- Planned capacity
- 17.7 GW
- Announced capex
- $503.6B
2,300+ projects
Tracked across all 50 states with verified updates. See the data on a live walkthrough.
How US data centers get built
Analysis of the pipeline, the states gaining share and the companies behind it.
Planned, proposed and under construction. Permits, contractor bids, RFPs, MW specs, site locations, and verified developer contacts, from ground-break to power-on.
Dots are representative: each dot stands for one project (or 100 MW / $2B on the Capacity and CapEx views), placed at random within its state. The exact site location (latitude and longitude) of every project is available in our database.
Market Intelligence
Where the US data center construction pipeline is concentrated: investment, planned MW capacity, and project counts for all 50 states, updated daily and rolled up by region for the Northeast, Southeast, Midwest, Southwest, and West Coast. Use it to size a market, compare states, or find where new data centres are being built next.
Development stage
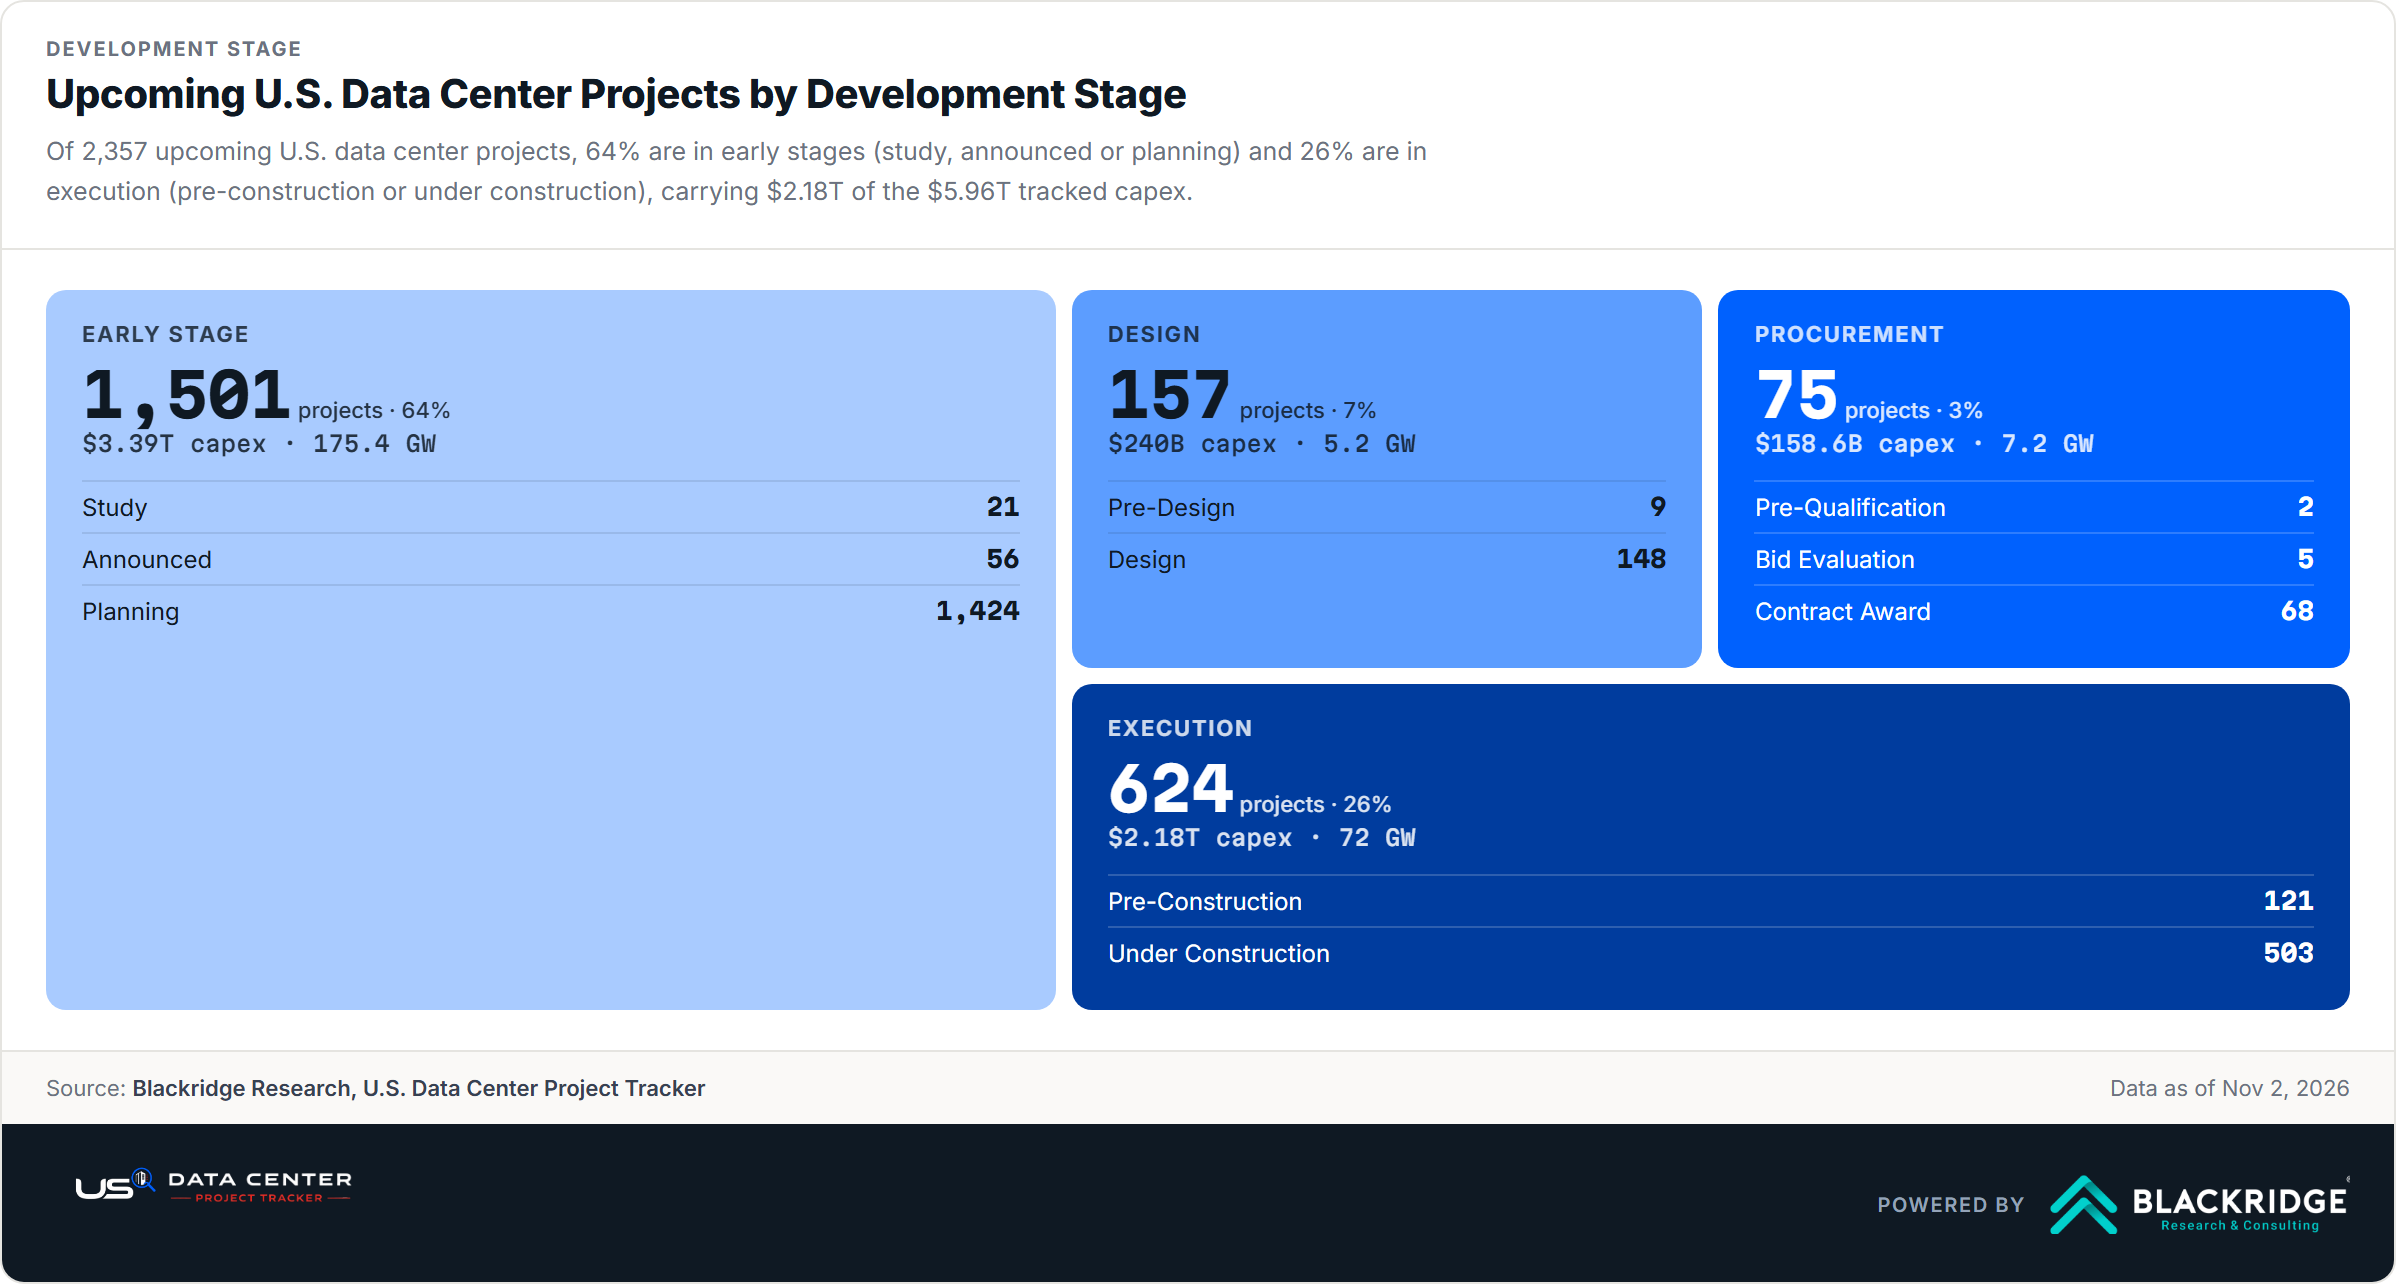
Of 2,357 upcoming U.S. data center projects, 63% are in early stages (study, announced or planning) and 27% are in execution (pre-construction or under construction), carrying $2.19T of the $5.94T tracked capex.
Early Stage
1,488 projects · 63%
$3.36T capex · 173.2 GW
Design
153 projects · 6%
$229.1B capex · 5.2 GW
Procurement
82 projects · 3%
$163.7B capex · 7.2 GW
Execution
634 projects · 27%
$2.19T capex · 70.4 GW
| Stage | Phase | Projects | Capacity | CapEx |
|---|---|---|---|---|
| Announced | Early Stage | 58 | 10.1 GW | $155.5B |
| Planning | Early Stage | 1,430 | 163.1 GW | $3.21T |
| Pre-Design | Design | 8 | 1.4 GW | $27.6B |
| Design | Design | 145 | 3.8 GW | $201.4B |
| Pre-Qualification / Pre-tender | Procurement | 2 | - | $200M |
| Bid Evaluation | Procurement | 5 | - | $720M |
| Contract Award | Procurement | 75 | 7.2 GW | $162.8B |
| Pre-Construction | Execution | 127 | 6.5 GW | $328.6B |
| On-going / Under Construction | Execution | 507 | 63.9 GW | $1.86T |
| Total | 2,357 | 256 GW | $5.94T |
State markets
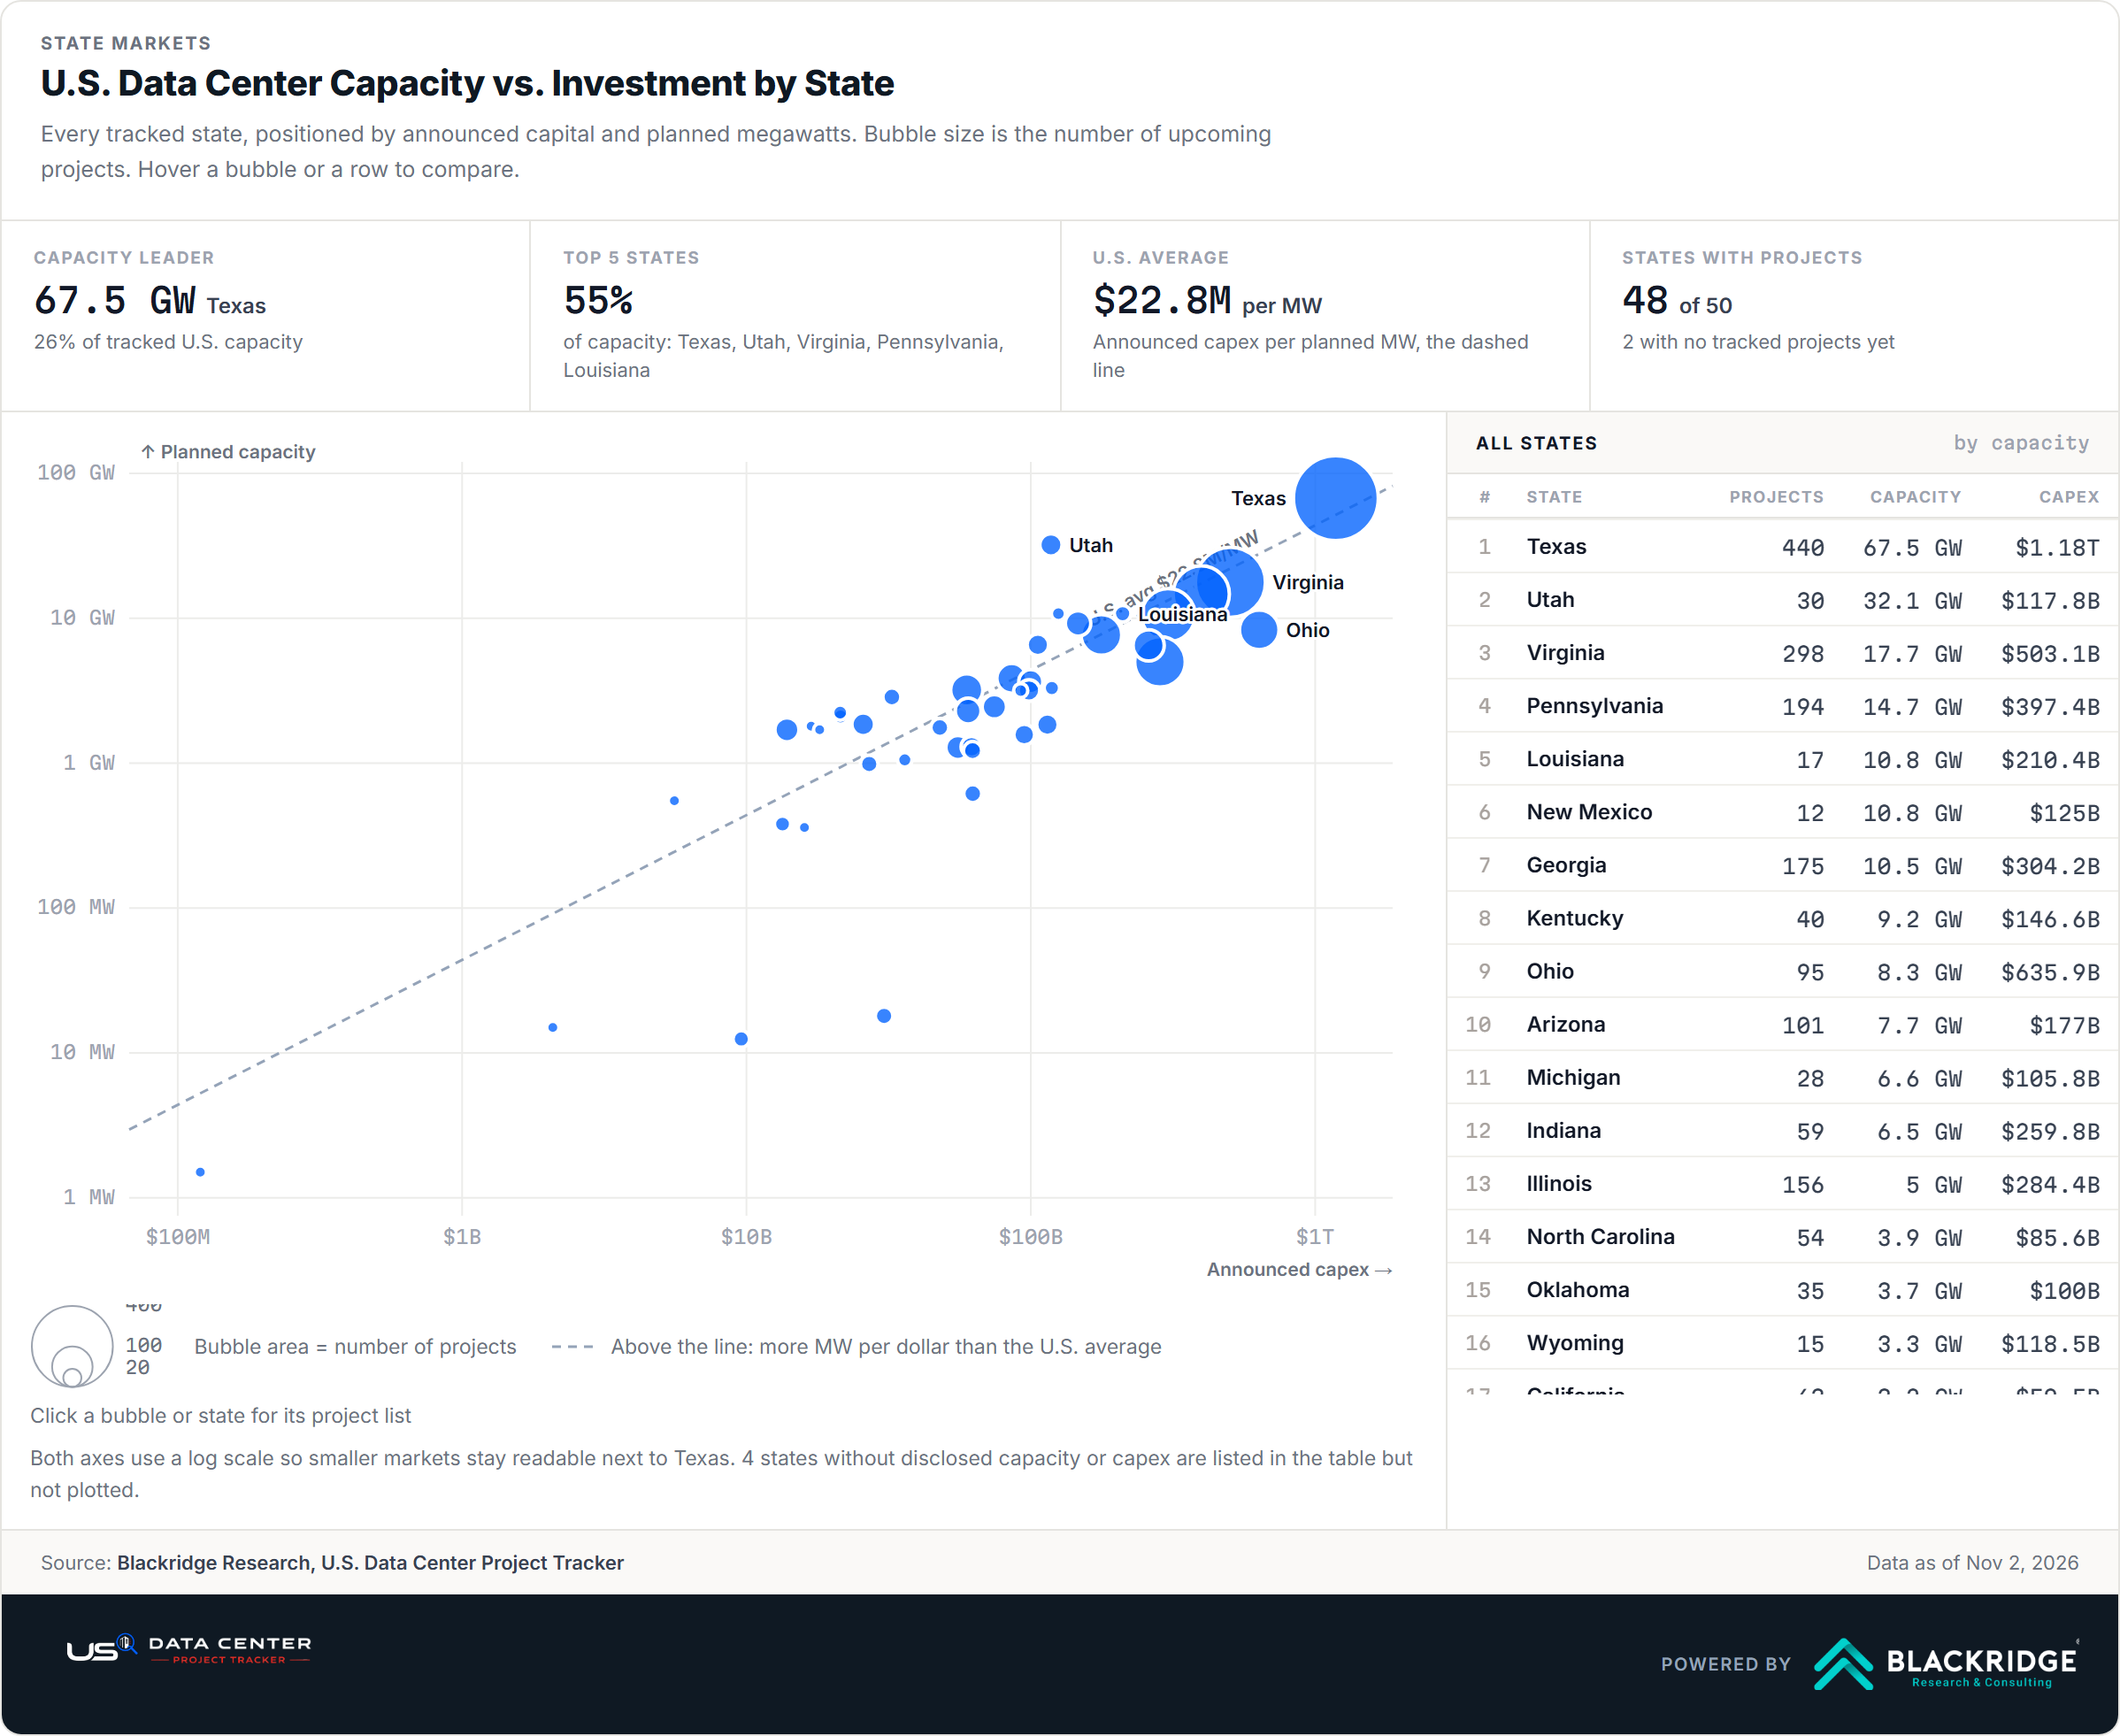
Every tracked state, positioned by announced capital and planned megawatts. Bubble size is the number of upcoming projects. Hover a bubble or a row to compare.
Capacity leader
65.6 GWTexas
26% of tracked U.S. capacity
Top 5 states
55%
of capacity: Texas, Utah, Virginia, Pennsylvania, Louisiana
U.S. average
$23.1Mper MW
Announced capex per planned MW, the dashed line
States with projects
49of 50
1 with no tracked projects yet
| # | State | Projects | Capacity | CapEx |
|---|---|---|---|---|
| 1 | Texas | 436 | 65.6 GW | $1.16T |
| 2 | Utah | 29 | 32.1 GW | $116.8B |
| 3 | Virginia | 300 | 17.3 GW | $528B |
| 4 | Pennsylvania | 193 | 14.7 GW | $389.2B |
| 5 | Louisiana | 21 | 10.8 GW | $210.6B |
| 6 | New Mexico | 12 | 10.8 GW | $125B |
| 7 | Georgia | 177 | 10.5 GW | $302.2B |
| 8 | Kentucky | 40 | 9.2 GW | $146.6B |
| 9 | Ohio | 87 | 8.3 GW | $632.4B |
| 10 | Arizona | 113 | 7.3 GW | $181.6B |
| 11 | Michigan | 28 | 6.6 GW | $114.8B |
| 12 | Indiana | 58 | 5.5 GW | $260.7B |
| 13 | Illinois | 154 | 5 GW | $268.6B |
| 14 | North Carolina | 54 | 3.8 GW | $85.4B |
| 15 | Oklahoma | 37 | 3.7 GW | $95.7B |
| 16 | Wyoming | 14 | 3.3 GW | $118B |
| 17 | California | 65 | 3.2 GW | $60.6B |
| 18 | West Virginia | 12 | 3.2 GW | $92.2B |
| 19 | Kansas | 28 | 3.2 GW | $98.5B |
| 20 | South Carolina | 21 | 2.9 GW | $33.7B |
| 21 | New York | 36 | 2.5 GW | $74.4B |
| 22 | Iowa | 40 | 2.3 GW | $60.4B |
| 23 | North Dakota | 15 | 2.2 GW | $36.3B |
| 24 | Maryland | 15 | 2.1 GW | $21.4B |
| 25 | Florida | 31 | 1.9 GW | $25.7B |
| 26 | Missouri | 26 | 1.8 GW | $96.4B |
| 27 | Delaware | 5 | 1.8 GW | $16.9B |
| 28 | Colorado | 20 | 1.8 GW | $47.9B |
| 29 | Nebraska | 4 | 1.7 GW | $18.1B |
| 30 | Connecticut | 35 | 1.7 GW | $13.9B |
| 31 | Nevada | 26 | 1.6 GW | $93.2B |
| 32 | Alabama | 27 | 1.3 GW | $62.4B |
| 33 | Oregon | 35 | 1.3 GW | $55.4B |
| 34 | Arkansas | 21 | 1.2 GW | $62.4B |
| 35 | Wisconsin | 14 | 1.1 GW | $40.1B |
| 36 | Minnesota | 19 | 987 MW | $28.4B |
| 37 | Mississippi | 19 | 616 MW | $62B |
| 38 | South Dakota | 2 | 550 MW | $5.6B |
| 39 | Tennessee | 16 | 380 MW | $13.4B |
| 40 | New Jersey | 7 | 360 MW | $15.8B |
| 41 | Washington | 19 | 18 MW | $31.7B |
| 42 | Maine | 5 | 15 MW | $2.1B |
| 43 | Idaho | 17 | 13 MW | $9.6B |
| 44 | Hawaii | 2 | 2 MW | $120M |
| 45 | Alaska | 5 | - | $3.7B |
| 46 | Massachusetts | 5 | - | $587M |
| 47 | Montana | 3 | - | $7.7B |
| 48 | New Hampshire | 1 | - | $20M |
| 49 | Rhode Island | 1 | - | $450M |
| Vermont | ||||
Of the 2,357 upcoming U.S. data center projects tracked, 22% are on-going or under construction, 61% are in planning, 5% in pre-construction and 12% in early development (announced, design and contract stages). The active-construction segment alone represents 63.9 GW of capacity and $1.86T in committed expenditure.
Texas, Ohio and Virginia lead U.S. data center investment by committed capital, accounting for 39% of total tracked CapEx. Texas holds the largest position with $1.16T across 436 projects, followed by Ohio ($632.4B) and Virginia ($528B).
By planned capacity, Texas, Utah and Virginia are the largest markets, together representing 45% of total tracked MW. Texas alone has 65.6 GW of committed pipeline, with Utah adding 32.1 GW and Virginia at 17.3 GW.
The highest average investment per project is recorded in New Mexico, Louisiana and Wyoming, at $10.4B, $10B and $8.4B per project respectively, indicating concentrated hyperscaler or utility-scale activity in these markets.
At the lower end of the investment scale, New Hampshire, Hawaii and Rhode Island show smaller average project sizes (as low as $450M per project), which typically reflects early-stage permitting activity, edge deployments, or co-location expansions rather than greenfield hyperscale builds.
1 state currently have no publicly tracked project data in this view. Blackridge Research maintains private intelligence on data center activity across all 50 states including pre-permit inquiries, land acquisitions, and utility interconnection filings not captured in public records. to access the full dataset.
Company Intelligence
Browse leading data center companies in the USA: hyperscalers, developers, and colocation providers, ranked by the number of upcoming data center projects each has in our US data center companies database.
Amazon Web Services, Inc. leads the U.S. data center pipeline with 66 upcoming projects, followed by Microsoft Corporation with 47. The top 10 companies together hold 339 projects, 18% of the combined company pipeline.
We track 714 developers, hyperscalers and colocation providers with upcoming data center projects in the United States. 83 of them have five or more projects and account for 51% of the pipeline, while 457 companies (64%) are building a single project.
Site Imagery
The largest U.S. data center clusters seen from above, with the tracker's project counts, planned capacity and capex for each state.
Ashburn, Virginia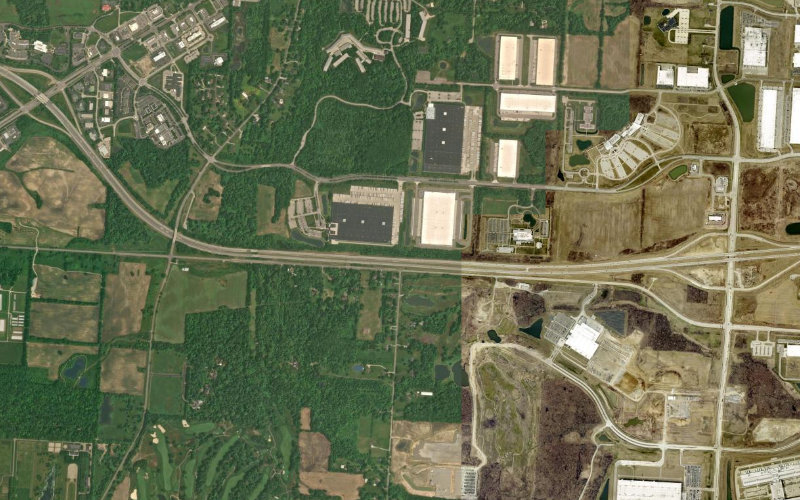 New Albany, Ohio
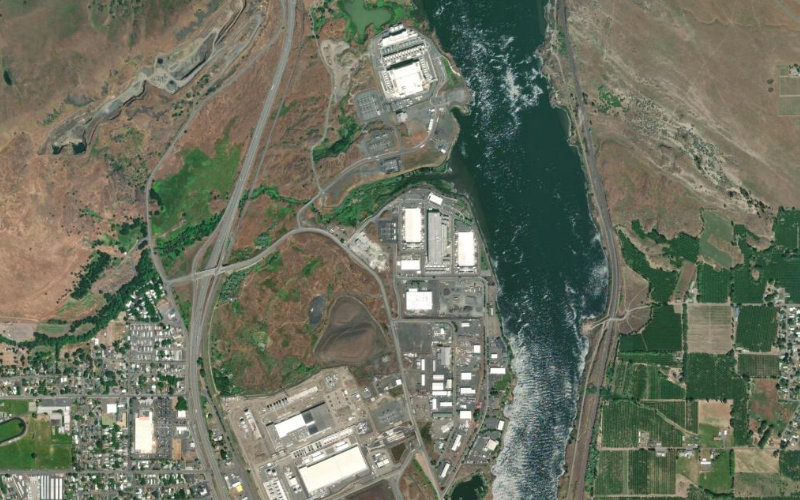 The Dalles, Oregon
Verified Contacts
Each project lists the developers, contractors, utilities and consultants involved, with role, company and direct contact details.
Owner / Developer
Name hidden
General Contractor
Name hidden
Utility / Power Provider
Name hidden
Site Selection Consultant
Name hidden
Sample layout. Names, titles and contact details are hidden until you start a trial.
Integrations
Pull projects through the API, sync them into your CRM, or export any view. Alerts reach your team in Slack or by email.
REST API
GET /v1/projects?state=Kentucky
{
  "name": "META - Mason Hyperscale Data Center",
  "owner": "Meta Platforms, Inc. (Meta)",
  "state": "Kentucky",
  "capex": "$10.0B",
  "stage": "Upcoming",
  "type": "Greenfield - New"
}
Example request
CRM sync
| Tracker | CRM record |
|---|---|
| Project | Deal / opportunity |
| Owner | Account |
| Contacts | Contacts |
| Stage | Pipeline stage |
| Capex, MW | Deal value fields |
Exports and alerts
#dc-pipeline · Tracker
New project in Kentucky: META - Mason Hyperscale Data Center, $10.0B
Example alert
Market Research
Market size, share and growth forecast for the US data center market, built on the same project pipeline this tracker follows every day.
Inside the report
Licence
Recent Intelligence
The latest US data center project announcements, groundbreakings, campus expansions, and data centers under construction, published as they are reported.
Michigan · Nov 10, 2026
Hyperscale Data, Inc. (NYSE American: GPUS) confirmed on November 10, 2026 that it had finished selling off its Bitcoin holdings, disposing of approximately 211.56 Bitcoin at roughly USD 76,000 per coin for gross proceed…
Utah · Nov 10, 2026
Lydian Energy has announced that its Faraday battery energy storage system, located in Utah County, Utah, has reached commercial operation. The 150 MW/600 MWh project began operating and delivers contracted storage capac…
New Jersey · Nov 10, 2026
In a unanimous floor vote late last month, the New Jersey Senate approved Senate Bill 4304, legislation that would make it illegal for data center developers to use non-disclosure agreements to conceal project details fr…
National · Nov 10, 2026
A permitting bill that critics describe as a "massive giveaway" to the artificial intelligence data center industry has been passed by Congress.Federal action amid rising local unrestThe legislation could ease the constr…
Texas · Nov 10, 2026
A property tax abatement agreement and an accompanying economic development agreement will go before the Starbase City Commission at a 7 p.m. CT meeting on Dec. 9, according to a public hearing notice issued by the City…
National · Nov 9, 2026
Under the deal, finalized in late September between Anthropic's corporate leadership and OnePWR Solutions, the AI developer took over an equipment order queue that OnePWR had placed with heavy machinery manufacturer Cate…
What's Inside
Most data center bid opportunities never reach a public tender portal. We follow each project from the first site plan filed with the planning commission through to the general contractor award, so estimating and business development teams can qualify work months before an RFP is issued.
Coverage runs from national EPC contracts down to single subcontract packages: sitework and clearing, concrete and paving, structural steel, switchgear, and mechanical fit-out. Filter data center construction contracts by region, Northeast, Southeast, Midwest, Southwest or West Coast, or by state, and set alerts for new awards in your service area.
Why A Tracker
Discovery is now a solved, subscribable problem. Deal selection and relationships are not.
| Dimension | DIY / Spreadsheets | Tracker |
|---|---|---|
| Pre-announcement discovery | Costly, partial | Land, zoning & grid signals |
| Code-name resolution | Sometimes | Primary-research verified |
| Contacts | Hunted, quickly stale | Verified, role-tagged, refreshed |
| Change detection | Whenever re-checked | Daily monitoring + alerts |
| Tender awareness | Sporadic | Systematic, with deadlines |
| Institutional memory | Leaves with employee | Permanent, shared, CRM-synced |
| Annual cost | $40,000–$75,000 per researcher | Fraction of one hire |
FAQ
Get Started
Join investors, developers, and contractors who use our database to stay ahead of the US data center market.
Weekly Intelligence
Project timelines, capex, MW capacity & developer activity across all 50 states, every Monday, before it hits the wire.
No spam. Unsubscribe anytime.